

Time-series Characteristics of Unsafe Events in Air Traffic Based on Visibility Graph
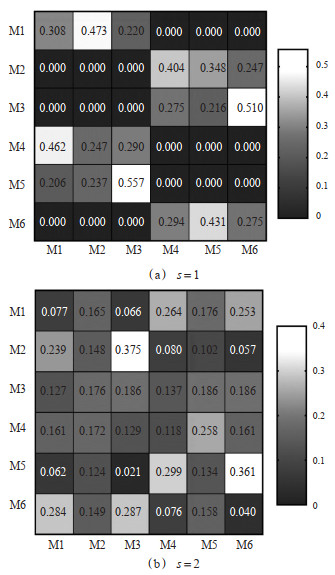
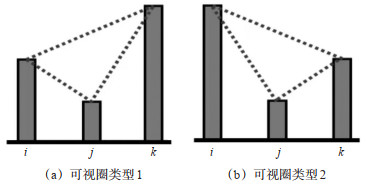
-
摘要: 空中交通安全事故的时间序列特性分析,是深入理解空中交通安全的重要手段。为分析空中交通不安全事件的时序特性,提出了基于可视图的不安全事件时序特性分析方法。采用可视图对空中交通不安全事件建模,将时间序列映射成复杂网络;再利用网络的度分布、聚类系数等拓扑指标,分析空中交通不安全事件的静态特征;在此基础上,考虑各事件间的高阶影响及作用模式,构造可视圈比指标,辨识不同事件对整体安全的差异化影响;再针对整体安全水平的动态演化特性,在可视图序模体基础上引入表征时序演化的三阶时序结构,描述不安全事件时间序列的微观演化特性。为验证所提方法的有效性,对2007—2021年美国发生的578起空中交通不安全事件进行实证分析,结果表明:①空中交通不安全事件时间序列可视图在宏观和微观尺度下度值均呈长尾分布,聚类系数均大于0.7;②不安全事件时间序列可视图网络具有小世界网络特征,宏观序列度分布服从于系数为1.852的幂律分布;③具有无标度特性不同地区的可视图网络同样具有小世界网络特征,地区间的网络规模与网络密度存在显著差异,揭示了不安全事件发生频率具有空间异质性可视圈的时序结构占比33.2%,圈比结构指标对网络鲁棒性具有重大影响,证明了圈比指标可用于辨识不同事件对整体安全水平的作用,辨识精度优于度值与节点强度等指标;④三阶时序结构在步长为1和2的情况下,呈现明显的转移特征。综上,空中交通不安全事件的发生是有别于随机性与周期性的复杂性系统性行为,不同区域间的不安全水平具有空间异质性与阶段演进性特征。考虑网络高阶结构影响,管控少数高圈比值节点可从宏观角度提升整体安全水平。分析时序结构的转移模式与趋势偏好,可以从微观角度揭示空中交通不安全事件随时间演变的内在规律。有助于预测潜在的风险点,从而为制定有效的预防措施和安全管理决策提供科学依据。Abstract: Time series characteristics of traffic accidents is crucial for understanding air traffic safety. To analyze the characteristics of air-traffic-accident time series, a visual graph (VG) method is proposed. The unsafe-event time series (UETS) are mapped into complex network via the VG, and then the static characteristics of the UETS are described by the topological indicators such as degree distribution and clustering coefficient. Considering the higher-order influences and interaction modes between events, a visual circle ratio index is developed to evaluate the impacts of each event on the entire safety level. A third-order temporal structure representing temporal evolution is proposed based on the sequential model from the VG, describing the dynamic micro- characteristics of the UETS. To demonstrate the proposed method, an empirical analysis is conducted based on 578 unsafe air traffic events that occurred in the United States from 2007 to 2021, and the results indicate that: ① the VG of the UETS exhibit a long-tail degree distribution at both macroscopic and microscopic scales, with clustering coefficients all greater than 0.7; ② the VG network of the UETS possesses small-world characteristics, and the macroscopic sequence-degree distribution follows the power-law distribution with a coefficient of 1.852, indicating scale-free properties of the network; ③ the visibility graphs of different regions also exhibit the characteristics of small-world networks, with significant differences in network size and density among regions, revealing the spatial heterogeneity in the frequency of unsafe events. The visual circle index of the network reaches 33.2%, the circle ratio structural indicator has a significant impact on network robustness, demonstrating that the circle ratio index can be used to identify the effects of different events on the overall safety level. ④ the third-order temporal structure shows significant transition characteristics when the step size is 1 and 2. In summary, this paper reveals that the occurrence of unsafe air traffic events has complex pattern that differs from randomness and periodicity patterns, The safety levels among different regions exhibit spatial heterogeneity and temporal evolution characteristics. Considering the impact of higher-order network structures, managing a minority of nodes with high circle ratios can enhance the overall safety level from a macro perspective. Analyzing the transfer patterns and trend preferences of temporal structures can reveal the intrinsic laws of how air traffic unsafe events evolve over time from a micro perspective. This is conducive to predicting potential risk points, thereby providing a scientific basis for formulating effective preventive measures and safety management decisions.
-
Key words:
- aviation safety /
- air traffic management /
- time series /
- complex networks /
- visibility graph
-

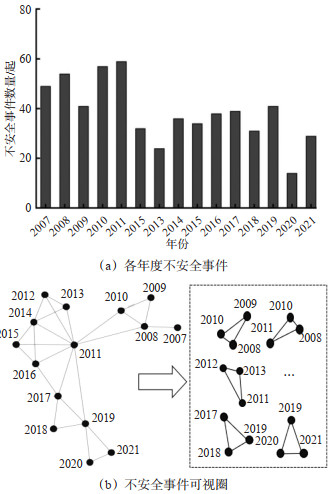
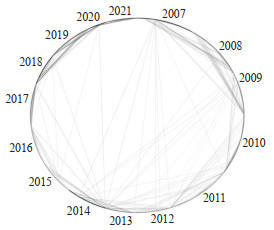
图 6 2007—2021年空中交通不安全事件可视图
Figure 6. Visibility graph of air traffic unsafe incidents from 2007 to 2021

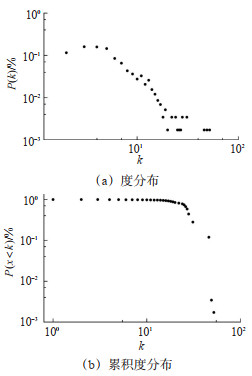
图 7 空中交通不安全事件可视网络度及累积度分布
Figure 7. Distribution of visibility graph degree and cumulative degree of air traffic unsafe events

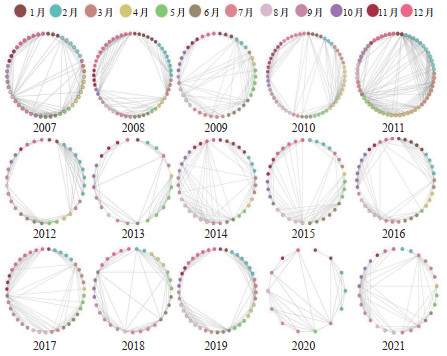
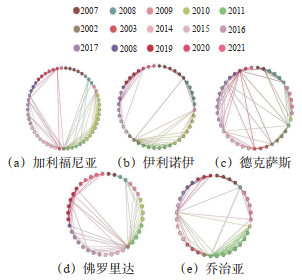
图 8 不同年份下的空中交通不安全事件可视图
Figure 8. Visibility graph of air traffic unsafe events by year

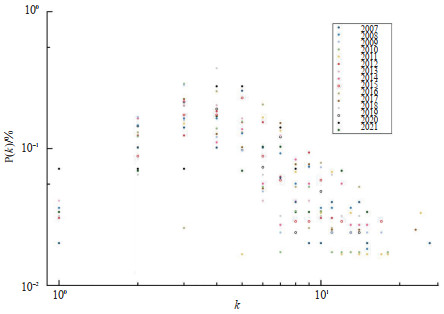
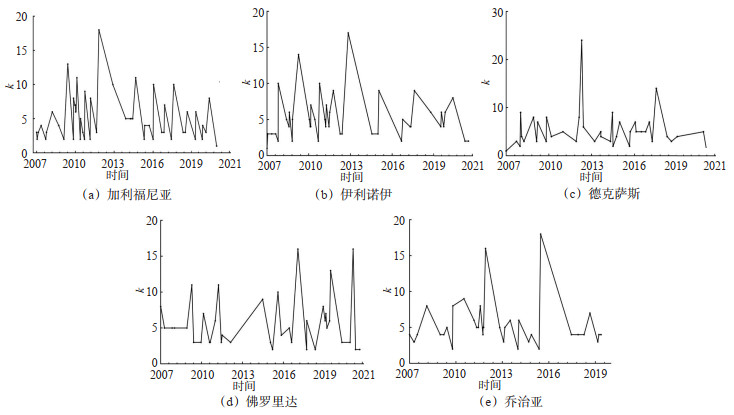
图 9 不同年份下空中交通不安全事件网络度分布
Figure 9. Distribution of air traffic unsafe events visibility graph degrees by year

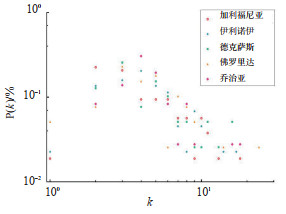
图 11 不同地区空中交通不安全事件度值分布
Figure 11. Degree distribution of air traffic unsafe events visibility network in different regions
表 1 空中交通不安全事件可视图网络度量指标
Table 1. Air Traffic Unsafe Events Visibility Network Measurements
度量指标 符号表示 物理含义 节 n 空中交通不安全事件 节点强度 y 节点与前1个节点间的时间间隔长度 度 $k i=\sum_j e i j$ 与节点i连接的可视线数量 度分布 $p(k)=\frac{|n(k)|}{|n|}$ 可视图节点的度分布情况用p(k) 表示,n(k)为度为k的节点集合 聚类系数 $C i=\frac{2 e i}{k i(k i-1)}$ 与节点i所有相邻节点间实际可视线数目占这些点可能形成的最大可视线数目的比例 网络直径 $D = \mathop {{\rm{max}}}\limits_{1 \leqslant i < j \leqslant n} dij$ 网络直径D为所有的最短可视线dij中最长的1条边 代数连通性 AC = λ 可视图拉普拉斯矩阵的第二小特征值 平均路径长度 $L=\frac{2}{n(n-1)} \sum\limits_{i>j} d i j$ 平均路径长度L为网络中任意2个节点间距离的平均值  下载: 导出CSV
表 2 2007—2021年美国国家运输安全委员会航空事故数据样例
Table 2. Sample data on aviation air traffic unsafe events, national transportation safety board, 2007-2021
事件日期 发生地点 事件类型 事件等级 2007/1/1 17:30 科罗拉多 事故征候 无 2007/1/7 13:40 俄克拉荷马 事故征候 无 2007/1/23 16:00 印第安纳 事故征候 较严重 2007/3/1 22:35 德克萨斯 事故征候 较严重 20073/15 14:51 伊利诺伊 事故征候 无 2007/3/27 17:05 堪萨斯 事故征候 较严重 2007/4/4 14:35 阿肯色 事故 严重 2007/4/9 16:45 威斯康辛 事故征候 无
下载: 导出CSV
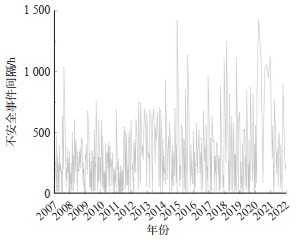
表 3 空中交通不安全事件时间间隔序列统计指标
Table 3. Statistical indicators of time interval series of air traffic unsafe events
统计指标 指标值/h 统计指标 指标值 最大值 1 423.630 序列偏度 1.898 平均值 227.673 序列峰度 4.260 最小值 0.117 Hurst指数 0.567 标准差 229.380 Lyapunov指数 0.023
下载: 导出CSV
表 4 空中交通不安全事件网络特征
Table 4. Topology characteristics of air traffic unsafe events visibility graph
网络特征 特征指标值 节点数 577 节点边数 1 894 平均强度 227.672 平均度 6.562 最大度值 52 平均聚类系数 0.780 平均路径长度 4.170 代数连通性 0.020 网络直径 8 网络密度 0.011
下载: 导出CSV
表 5 小世界网络特征参数
Table 5. Characteristic parameters of small-world networks
网络类型 聚类系数 平均最短路径 同规模随机网络 0.17 12.36 空中交通不安全事件可视图 0.78 4.17
下载: 导出CSV
表 6 不同年份空中交通不安全事件网络指标
Table 6. Network characteristics of air traffic unsafe incidents by year
年份 节点数 边数 平均强度 平均数 最大度值 聚类系数 网络直径 平均路径 图密度 2007 49 147 180.455 6.000 26 0.784 4 2.462 0.125 2008 54 147 159.865 5.440 15 0.766 7 3.420 0.103 2009 41 111 216.403 5.415 17 0.785 5 2.527 0.135 2010 57 149 152.128 5.228 18 0.777 6 3.053 0.093 2011 59 215 153.707 7.288 24 0.775 4 2.527 0.126 2012 32 81 281.203 5.062 11 0.795 7 3.010 0.163 2013 24 53 343.493 4.417 9 0.777 5 2.522 0.192 2014 36 102 268.133 5.667 15 0.768 4 2.416 0.162 2015 34 93 231.364 5.471 17 0.794 5 2.406 0.166 2016 38 110 243.842 5.789 14 0.804 4 2.465 0.156 2017 39 114 237.398 5.846 23 0.786 4 2.379 0.154 2018 31 80 269.976 5.161 14 0.811 4 2.292 0.172 2019 41 105 202.200 5.122 14 0.806 5 2.874 0.128 2020 14 32 680.000 4.571 8 0.769 4 2.022 0.352 2021 28 79 269.457 5.643 15 0.791 4 2.212 0.209
下载: 导出CSV
表 7 不同地区可视图社团结构
Table 7. Structure of communities in different regions
社团 不同地区社团结构 加利福尼亚 伊利诺伊 德克萨斯 佛罗里达 乔治亚 社团1 2007—2008 2007—2009 2007—2009 2007—2011 2007 社团2 2008—2009,2010—2012 2010—2012 2010—2013 2011—2014 2008—2009 社团3 2010 2010 2013—2016 2015—2017 2010—2013 社团4 2013—2017 2014—2017 2016—2018 2017—2021 2013—2015 社团5 2017—2021 2017—2021 2019—2021 2015,2017—2019
下载: 导出CSV
表 8 不同地区空中交通不安全事件网络特征参数
Table 8. Network characteristics of air traffic unsafe event network in different regions
地区 节点数 边数 平均强度 平均度 最大度值 聚类系数 直径 平均路径 图密度 加利福尼亚 53 135 2 342.575 5.094 18 0.735 8 3.144 0.098 伊利诺伊 44 115 2 909.612 5.227 17 0.762 6 2.933 0.122 德克萨斯 39 111 3 204.276 5.692 16 0.794 5 2.499 0.150 佛罗里达 39 104 3 297.761 5.333 24 0.723 6 2.440 0.140 乔治亚 36 96 3 122.132 5.333 18 0.794 5 2.449 0.152 纽约 32 88 4 070.836 5.500 14 0.799 5 2.494 0.177 科罗拉多 29 91 4 270.541 6.276 16 0.821 5 2.357 0.224 北卡罗莱纳 21 53 5 797.898 5.048 15 0.711 4 2.033 0.252 亚利桑那 18 41 6 897.737 4.556 12 0.703 4 2.327 0.268 密苏里 17 37 6 306.826 4.353 12 0.805 4 2.000 0.272
下载: 导出CSV
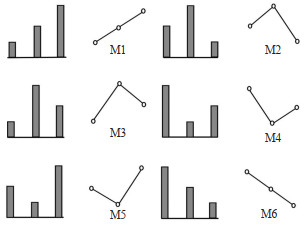
表 9 三阶时序结构出现频次分布
Table 9. Frequency distribution of occurrences of triadic motif structure
时序结构 出现频次 占比/% M1 91 15.8 M2 89 15.5 M3 102 17.7 M4 94 16.3 M5 97 16.9 M6 102 17.7
下载: 导出CSV
-
[1] SUN X Q, WANDELT S, ZHANG A M. A data-driven analysis of the aviation recovery from the COVID-19 pandemic[J]. Journal of Air Transport Management, 2023, 109: 102401. doi: 10.1016/j.jairtraman.2023.102401 [2] 王红勇, 温瑞英. 基于复杂网络的空中交通态势风险评估方法[J]. 中国安全科学学报, 2018, 28(5): 172-178.WANG H Y, WEN R Y. Research on assessment of risk in air traffic situation based on complex network[J]. China Safety Science Journal, 2018, 28(5): 172-178. (in Chinese) [3] 张洪海, 吕文颖, 万俊强, 等. 扇区空中交通风险态势网络建模与演化特征[J]. 交通运输工程学报, 2023, 23(1): 222-241.ZHANG H H, LYU W Y, WAN J Q, et al. Network modeling and evolution characteristics for air traffic risk situation in sectors[J]. Journal of Traffic and Transportation Engineering, 2023, 23(1): 222-241. (in Chinese) [4] JIANG X R, WEN X X, WU M G, et al. A complex network analysis approach for identifying air traffic congestion based on independent component analysis[J]. Physica A: Statistical Mechanics and Its Applications, 2019, 523: 364-381. doi: 10.1016/j.physa.2019.01.129 [5] 王兴隆, 尹昊, 贺敏. 基于LSTM的机场飞行区活动目标潜在冲突预测[J]. 北京航空航天大学学报, 2024, 50(6): 1850-1860.WANG X L, YIN H, HE M. Potential conflicts prediction of mobile in the airport airfield area based on LSTM[J]. Journal of Beijing University of Aeronautics and Astronautics, 2024, 50(6): 1850-1860. (in Chinese) [6] ZHANG M Y, LIANG B Y, WANG S, et al. Analysis of flight conflicts in the Chinese air route network[J]. Chaos, Solitons & Fractals, 2018, 112: 97-102. [7] YU H X, LI X. On the chaos analysis and prediction of aircraft accidents based on multi-timescales[J]. Physica A: Statistical Mechanics and Its Applications, 2019, 534: 120828. doi: 10.1016/j.physa.2019.04.064 [8] BAO J, CHEN Y X, YIN J N, et al. Exploring topics and trends in Chinese ATC incident reports using a domain-knowledge driven topic model[J]. Journal of Air Transport Management, 2023, 108: 102374. doi: 10.1016/j.jairtraman.2023.102374 [9] 王岩韬, 刘毓. 基于复杂网络的航班运行风险传播分析[J]. 交通运输系统工程与信息, 2020, 20(1): 198-205.WANG Y T, LIU Y. Flight operation risk propagation based on complex network[J]. Journal of Transportation Systems Engineering and Information Technology, 2020, 20(1): 198-205. (in Chinese) [10] DE V A, KALAGHER H, SANTIAGO B, et al. Go-around accidents and general aviation safety[J]. Journal of Safety Research, 2022, 82: 323-328. [11] SUBRAMANIAN S V, RAO A H. Deep-learning based time series forecasting of go-around incidents in the national airspace system[C]. AIAA Modeling and Simulation Technologies Conference, Kissimmee, Florida: AIAA, 2018. [12] SUI Z Y, WEN Y Q, HUANG Y M, et al. Maritime accidents in the Yangtze river: a time series analysis for 2011-2020[J]. Accident Analysis & Prevention, 2023, 180: 106901. [13] LACASA L, LUQUE B, BALLESTEROS F, et al. From time series to complex networks: the visibility graph[J]. Proceedings of the National Academy of Sciences, 2008, 105 (13): 4972-4975. [14] MARIAG G, JOSEPH H S. Near-miss management systems and observability-in-depth: handling safety incidents and accident precursors in light of safety principles[J]. Safety Science, 2017, 91: 154-167. [15] 陈述, 朱丽萍, 陈云, 等. 基于复杂网络的水电工程施工安全隐患时序特性[J]. 中国安全科学学报, 2022, 32(8): 61-66.CHEN S, ZHU L P, CHEN Y, et al. Sequential characteristics of safety hazards in hydropower project construction based on complex networks[J]. China Safety Science Journal, 2022, 32(8): 61-66. (in Chinese) [16] GOROCHOHWSKI T E, GRIERSON C S, BERNARDO M D. Organization of feed-forward loop motifs reveals architectural principles in natural and engineered networks[J]. Science Advances, 2018 4(3), 9751. [17] 刘宏志. 空中交通流量波动动态演化及其非线性分析[D]. 北京: 北京交通大学, 2020.LIU H Z. Dynamic evolution and nonlinearity analysis of air traffic flow fluctuations[D]. Beijing: Beijing Jiaotong University, 2020. (in Chinese) [18] FAN T, LV L, SHI D, et al. Characterizing cycle structure in complex networks[J]. Communications Physics, 2021, 4(1), 272. [19] MUECKLICH N, SIKORA I, PARASKEVAS A, et al. Safety and reliability in aviation-A systematic scoping review of normal accident theory, high-reliability theory, and resilience engineering in aviation[J]. Safety Science, 2023, 162: 106097. [20] 中国民用航空局. 2021年民航行业发展统计公报[R/OL]. (2022-05-18)[2024-07-04]. https://www.mot.gov.cn/tongjishuju/minhang/202206/P020220607377281705999 .Civil Aviation Administration of China. 2021 Civil Aviation Industry Development Statistical Bulletin[R/OL]. (2022-05-18)[2024-07-04].https://www.mot.gov.cn/tongjishuju/minhang/202206/P020220607377281705999 . (in Chinese)[21] SHEN-ORR S S, MILO R, MANGAN S, et al. Network motifs in the transcriptional regulation network of Escherichia coli[J]. Nature Genetics, 2002, 31(1): 64-68. [22] IACOVACCI J, LACASA L. Sequential visibility-graph motifs[J]. Physical Review E, 2016, 93(4): 042309. [23] 张勰, 肖恩媛, 刘宏志, 等. 基于3种可视图的进场航班流量波动特性适应性评估[J]. 交通信息与安全, 2022, 40(6): 92-105, 117. doi: 10.3963/j.jssn.1674-4861.2022.06.010ZHANG X, XIAO E Y, LIU H Z, et al. An evaluation method for the suitability of three visibility graphs in analyzing the fluctuation characteristics of arrival flight flows[J] Journal of Transport Information and Safety, 2022, 40(6): 92-105, 117. (in Chinese) doi: 10.3963/j.jssn.1674-4861.2022.06.010 -

 点击查看大图
计量
- 文章访问数: 46
- HTML全文浏览量: 29
- PDF下载量: 0
- 被引次数: 0